These Data Analysis & Visualization courses cover a broad spectrum of topics, ensuring you stay current with industry standards and best practices.
Stop struggling with complex data and let AI handle the heavy lifting, from automated mapping to advanced forecasting.
Stop struggling with complex formulas and start using AI to analyze, visualize, and manage your spreadsheets in seconds.

This course is designed to help beginners get started with AI-assisted programming using GitHub Copilot in Visual Studio Code. From set-up to your first changes.

Learn how to use AI to assist you in creating more compelling visuals that drive better decision making for your business partners.
Try LearnFormula Business and buy packages or courses at a discounted group (multi-license) rate.
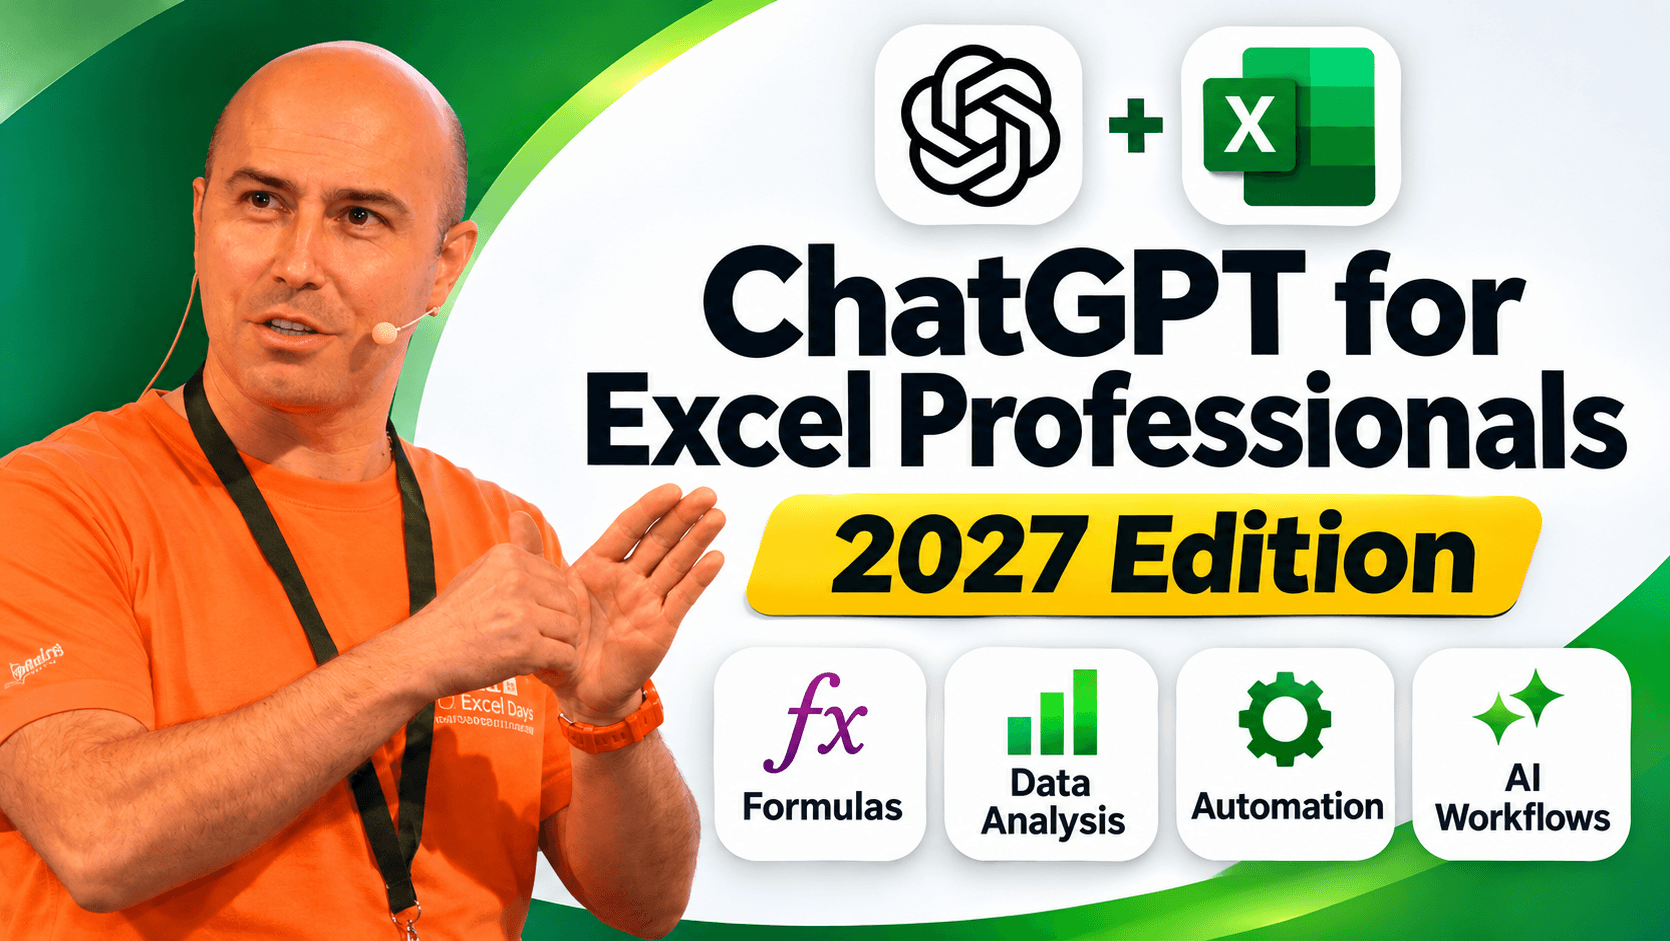
Supercharge your productivity by using AI to write complex formulas, automate tedious workflows, and transform raw data into stunning reports in seconds.
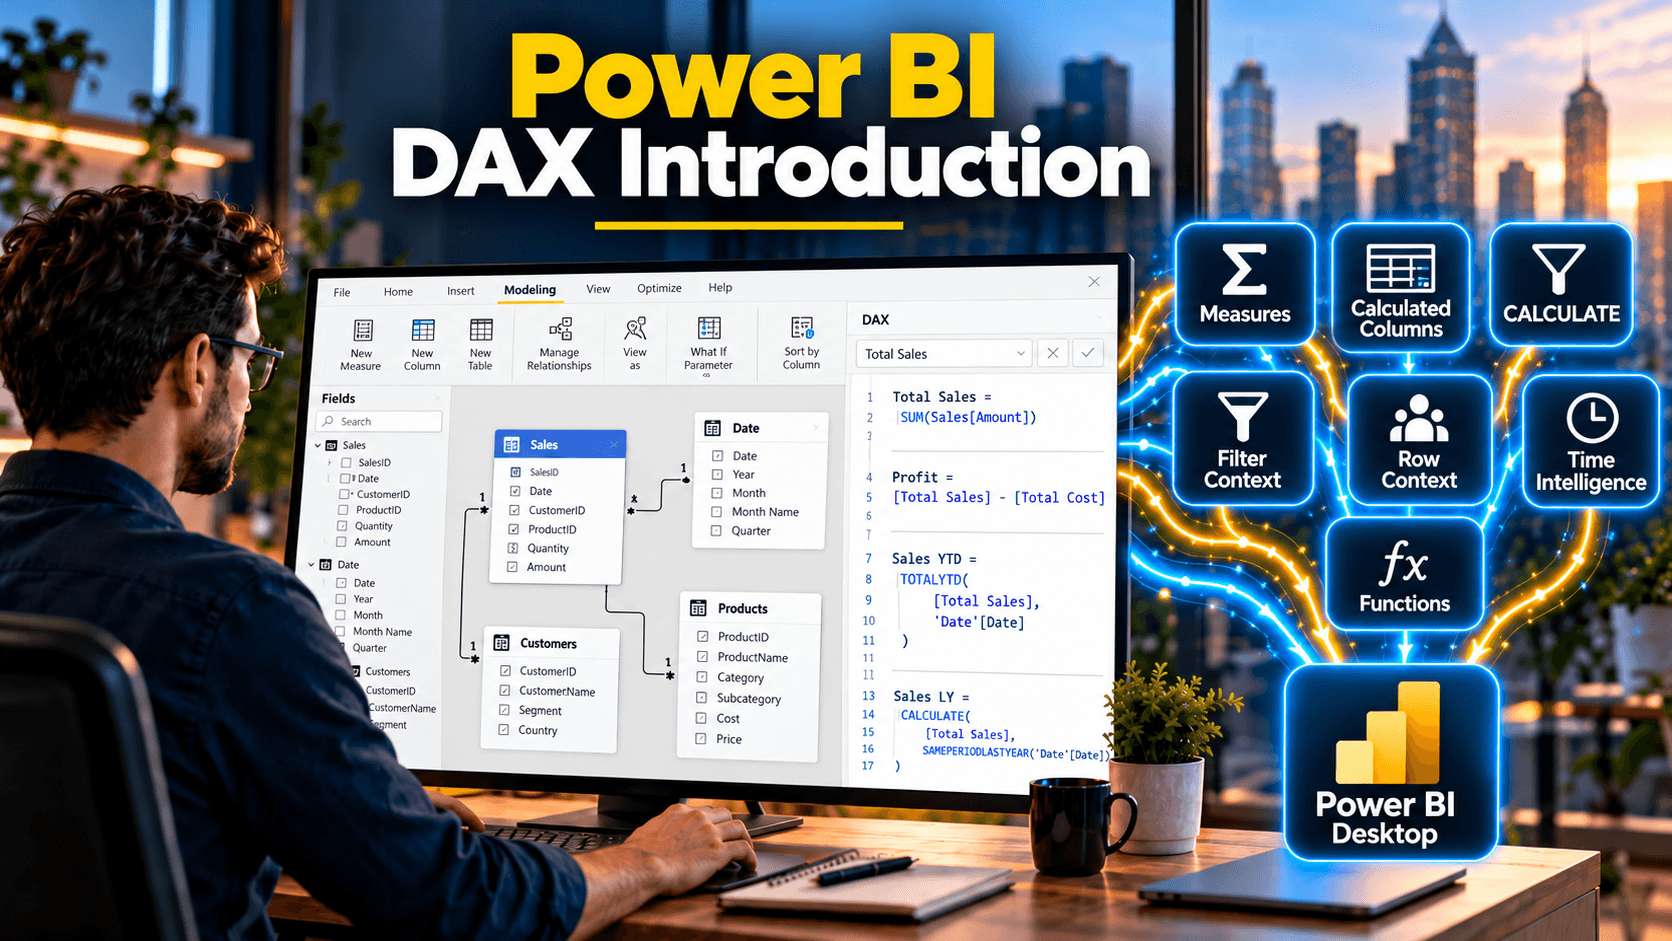
Write DAX calculated columns, calculated tables and measures with confidence, from RELATED and SWITCH to SUMX and CALCULATE
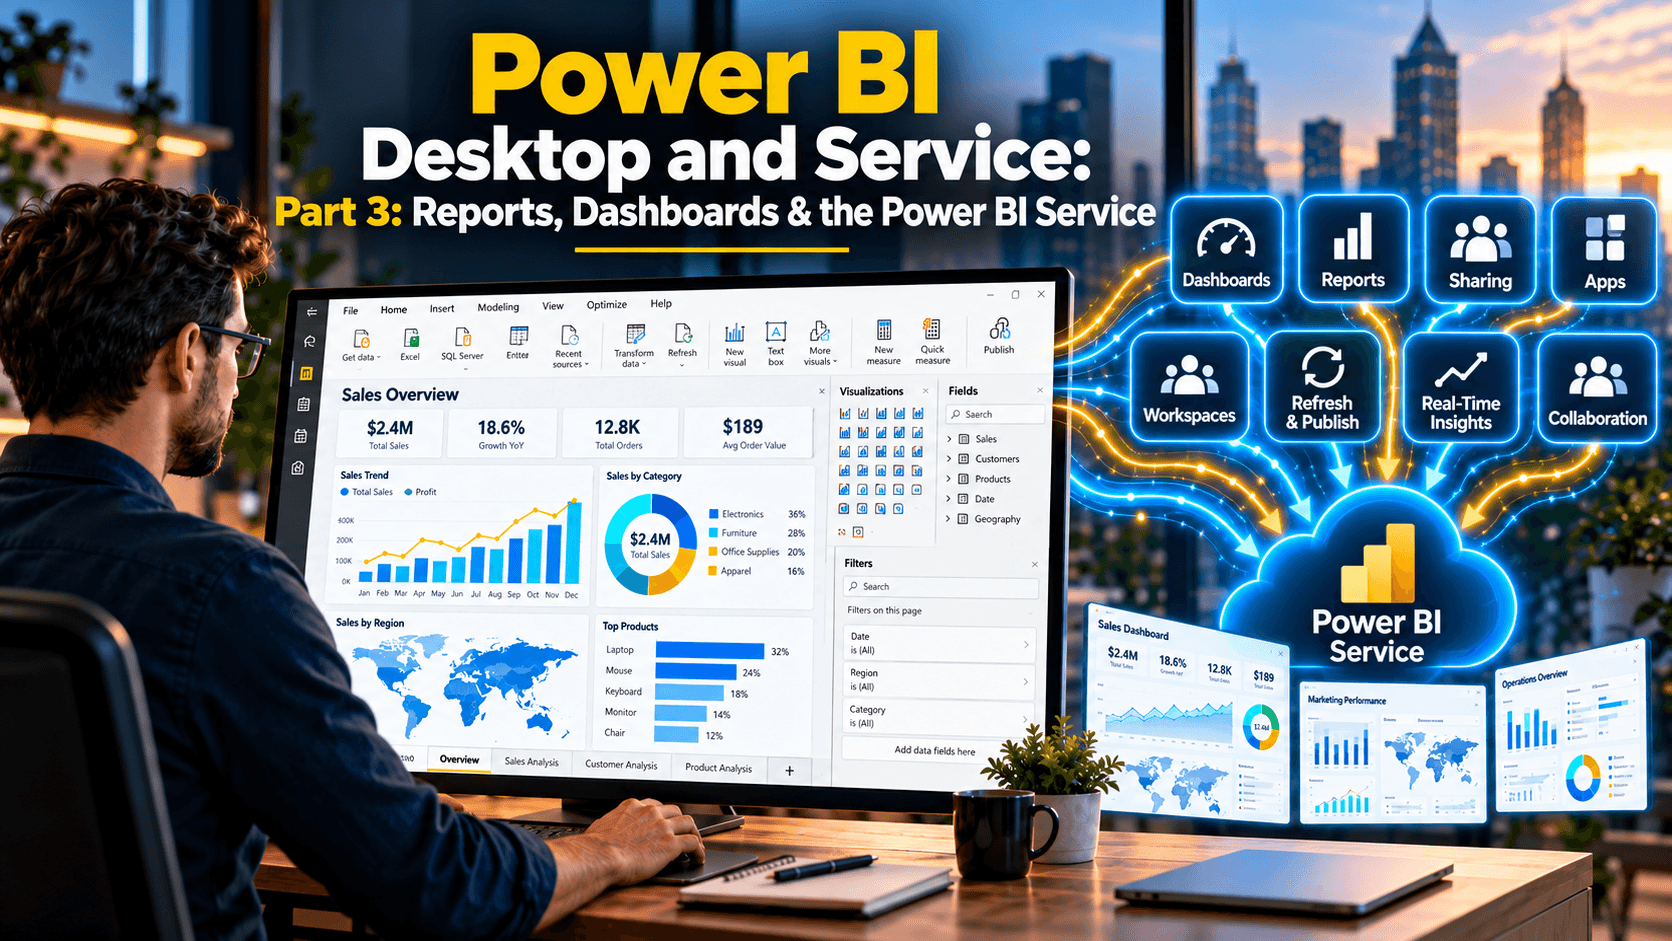
Design interactive Power BI reports, then publish, share and refresh them as dashboards and apps in the Power BI service
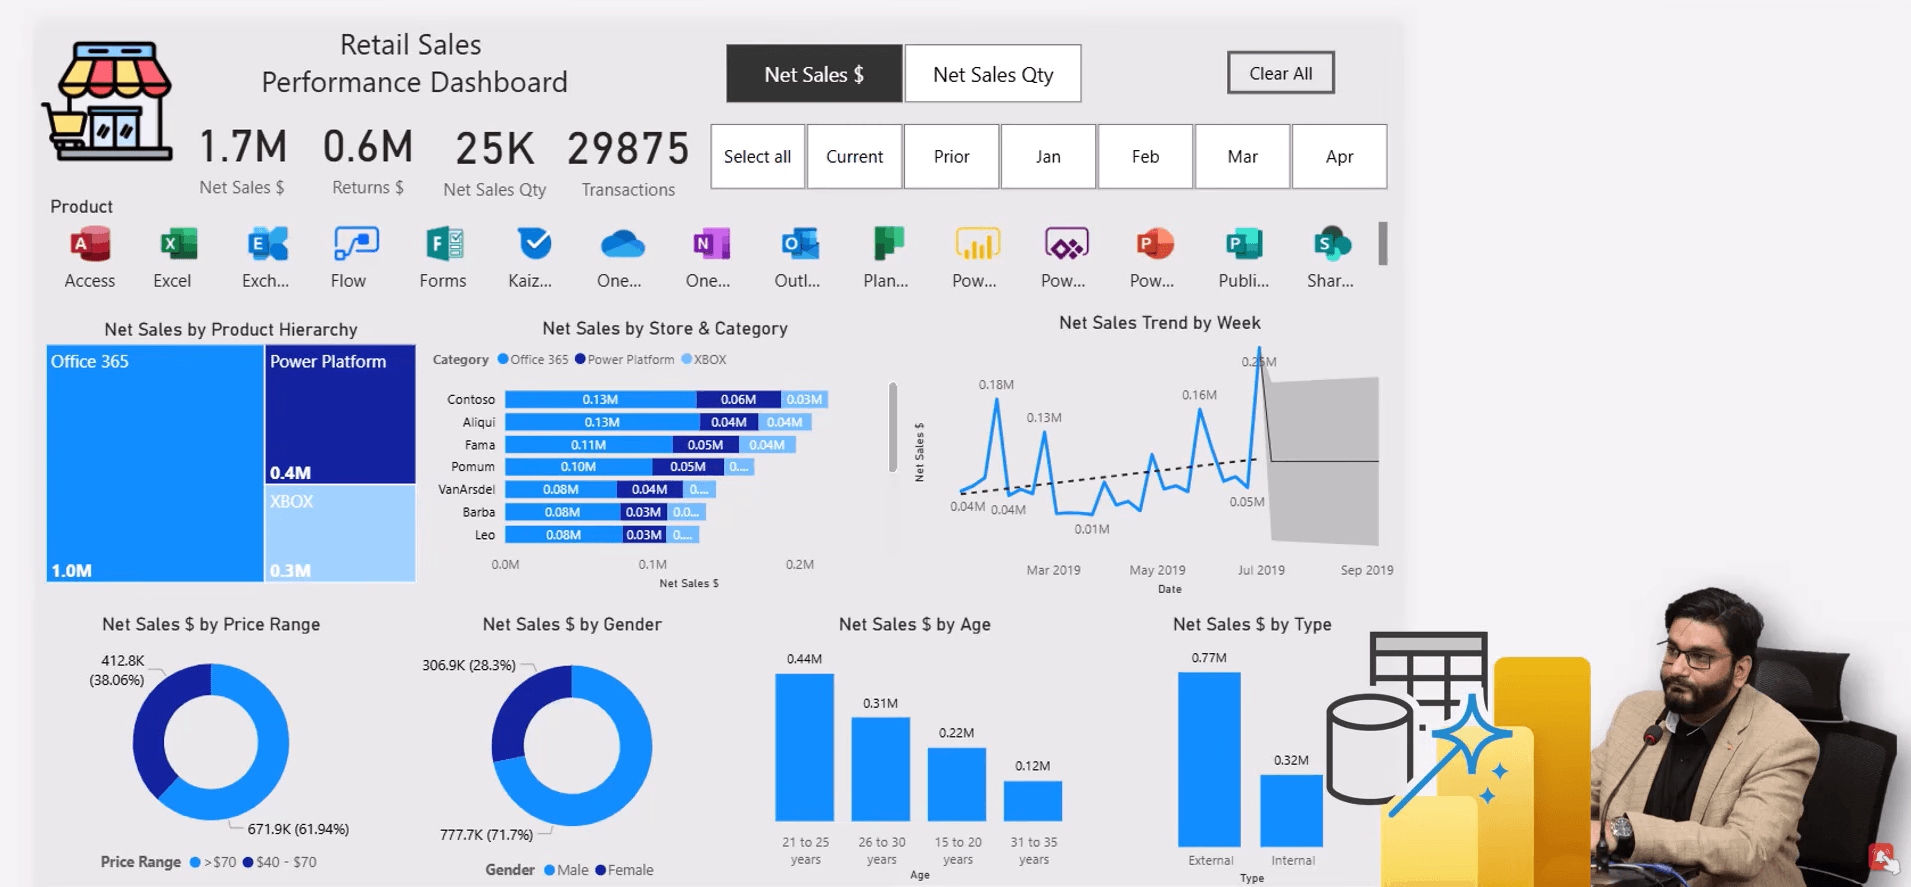
Master end-to-end data modeling, DAX measures, and interactive reporting for retail analytics.
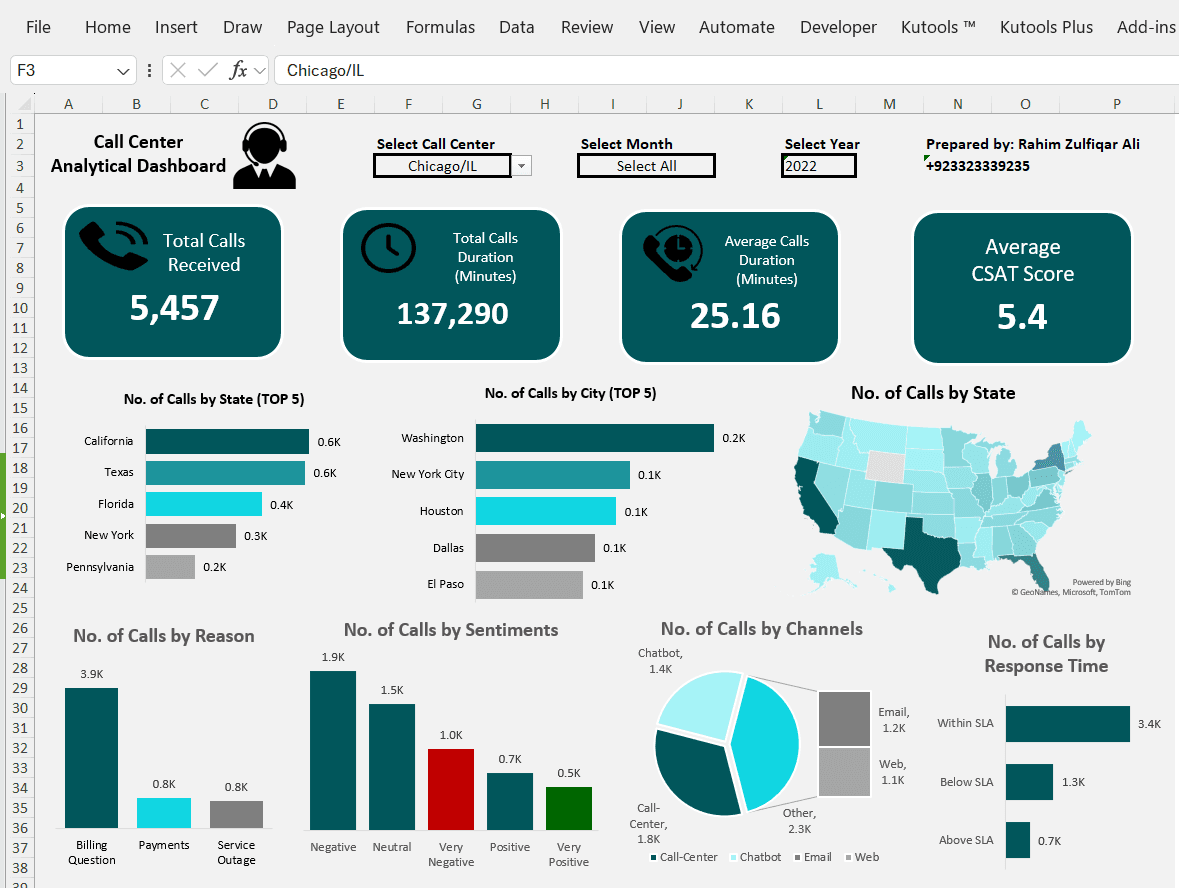
Master Power Query and dynamic array formulas to create interactive, automated reports that refresh in seconds.
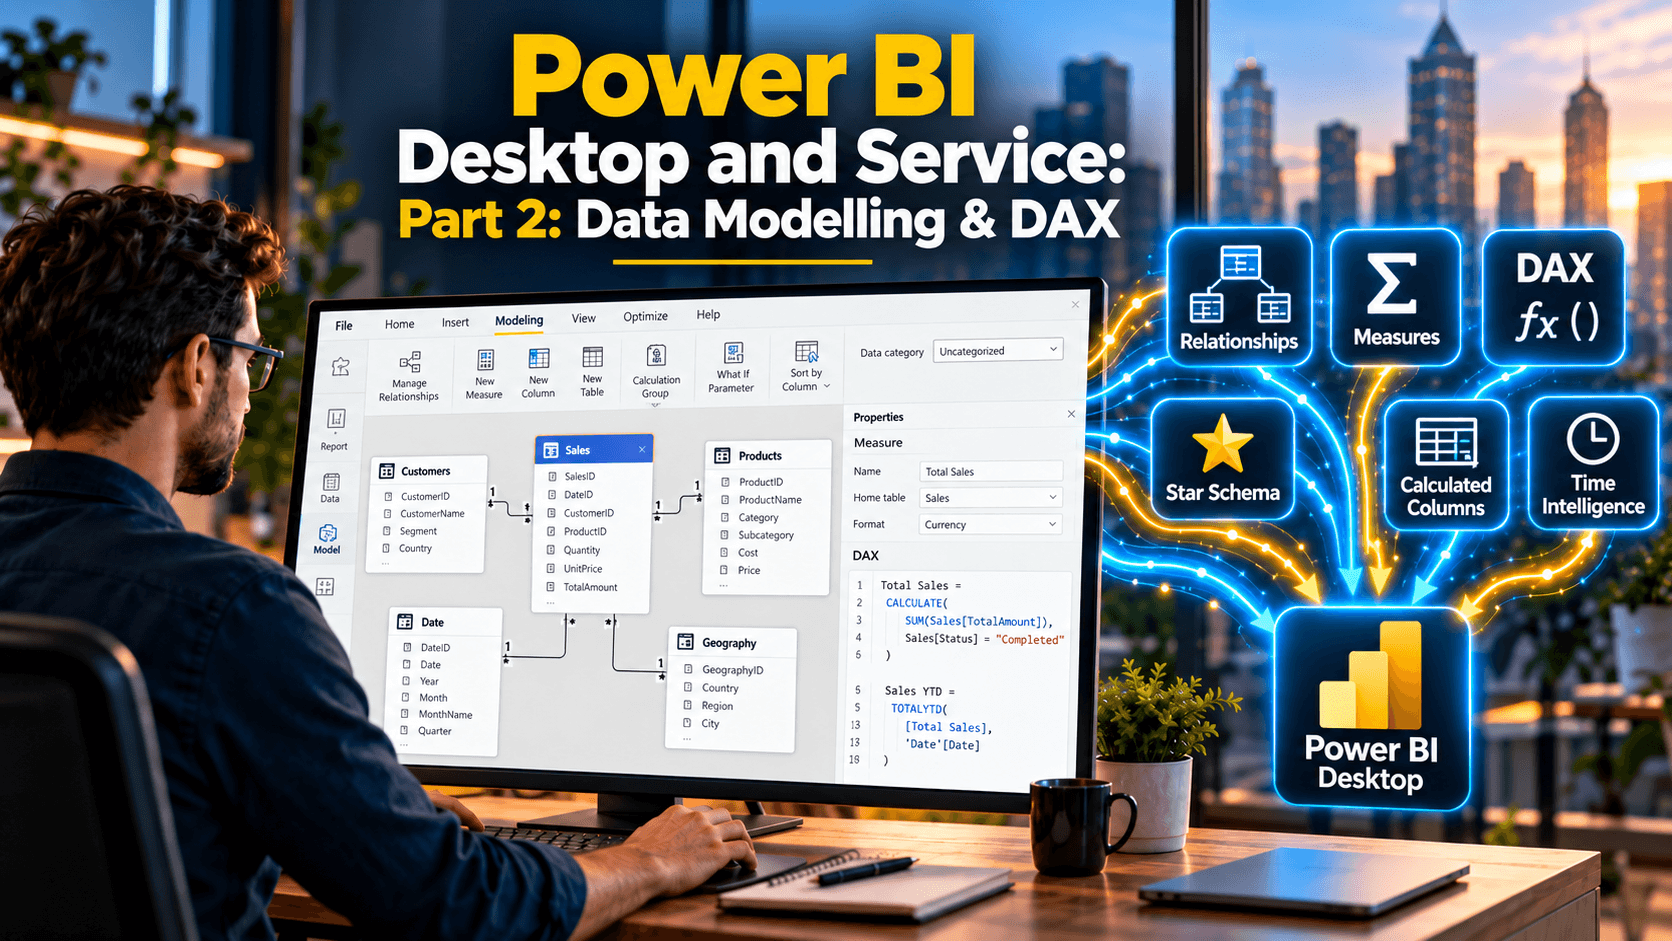
Build star-schema data models with date tables, relationships and hierarchies, then add calculated columns, measures, CALCULATE and time intelligence with DAX.